If you’re anything like me, you learned how to use programs like Photoshop and Gimp out of necessity to do minor changes to photos. You might have even dabbled in some easier graphic design projects for your own website, but it takes you hours to get the image or the design looking just right and you’re left exhausted. You might even spend time looking up tutorials on how to achieve a certain effect and still have trouble re-creating it.
In short, while you do know your way around the programs like Photoshop to a certain extent, it takes you forever and there’s absolutely no way you’d call yourself a graphic designer. But then, you’re surfing around the web and you noticed some really cool infographics on things like fashion, music and food and you can’t help but wish that you could create something like that; even if it’d take you a week.
Well, I’m here to tell you that it’s definitely possible to create some awesome infographics in any category that you choose, EVEN if you’re not a designer. In this blog post, I’m going to introduce you to three awesome tools to create the best infographics, tell you how to use them AND how you can share your infographics in different channels all over the web. So, let’s get started!
Introducing Easel.ly
First of all, I love the name of this tool, it’s a great play on words using easel (as in drawing pad) to play on easily’.
Launched two years ago in 2012, Easel.ly has hundreds of awesome infographic templates and design objects that even the most design novice can customize and share online. You can drag and drop design elements however you see fit or even upload your own background image from scratch as a template. The best part? Easel.ly is free!
Easel.ly is super popular with students, teachers and business owners who need to put together lesson plans or concepts in easy-to-follow visual forms. In fact, Easel.ly received the 2013 Best Websites for Teaching and Learning Award from the American Association of School Librarians (AASL).
So how does it work? Simply go to Easel.ly and click on ‘Create an Infographic’. Once you land on the page, you can pick a blank template or one of the other several hundred and get started!
Choose a category to find the best template that you want and then work your magic, dragging and dropping different backgrounds, themes, shapes, objects and putting in text. Then you can save it and share it through a browser link, a web link you can embed into your blog and share it via Facebook, Twitter and Pinterest!
In terms of going the extra mile in sharing your awesome infographic via social, you could even try attracting new audiences on LinkedIn, Google+ and Instagram and even using new tools like Glossi to create a new platform like an online magazine featuring cool infographics before sharing them. Creativity and a little out-of-the-box thinking can go a long way.
How to Describe Piktochart
Piktochart is another awesome online tool for creating cool infographics. It’s little more in-depth then Easel.ly in that it’s a software platform that allows you to embed videos, change the fonts, colours, add different line elements and even charts.
You can even import Google or Excel spreadsheets to create your own charts and customize the infographic by uploading your own images or using the more than 2000 high-res, print-ready graphics in the Piktochart library. Note: While you can change the colors of the icons and graphics from the Piktochart library, you can’t use the program to change the colors on your own images. You’d have to make the changes on an external program first
When it comes to sharing your Piktochart infographic, you can choose the size and the orientation, down to the paper size that you want to print it on. You can embed it in an email campaign and send it through your email campaign client such as MailChimp, MyEmma or Constant Contact and share it via Facebook, Twitter, Pinterest and Google+ just by uploading it to your status update.
You can even include it in online Flickr galleries and share it in your Google+ communities, LinkedIn groups and Google Hangouts to help make online collaborations a little more creative and visually informative.
How ReciteThis is Different
OK, so up until this point, I’ve been sharing a couple of really cool infographic tools with you that help you make IMAGE-based infographics. So they’re all a little more visual. But, what if you want to create a cool infographic using quotes or proverbs?
That’s where ReciteThis comes in. You can turn a quote into a masterpiece simply by typing whatever quote or proverb into the text box, or choosing a quote from the ReciteThis database. Then you select a background from a slideshow at the bottom of the page and press ‘Create’.
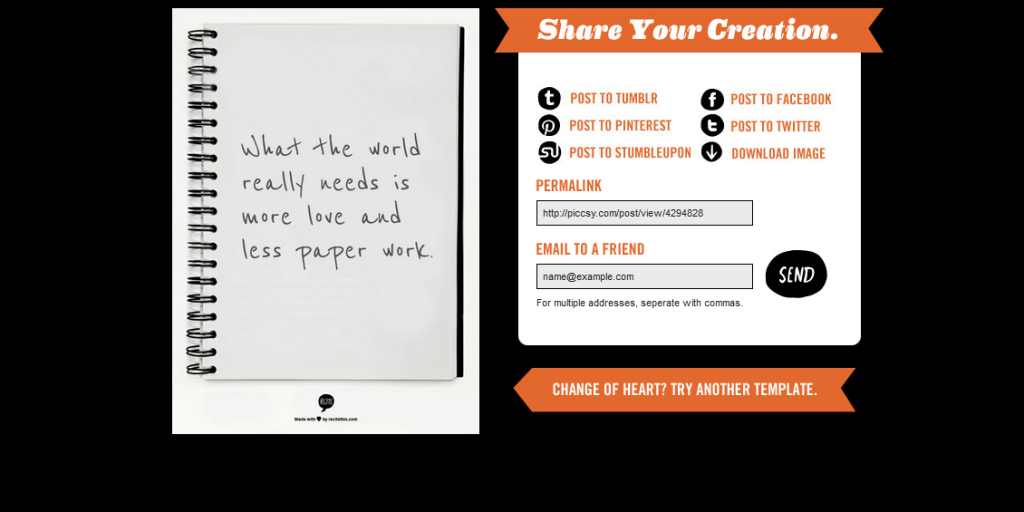
Afterwards, you have the option of posting it to Tumblr, Facebook, Twitter, Pinterest or StumbleUpon to share with friends, downloading it for printing purposes or to share with other platforms like LinkedIn or e-mailing it to anyone you want.
So now you know how to create some amazingly fun, creative and detailed infographics-even if you’re NOT a graphic designer! Keep it locked here for more great tips on content marketing, new social marketing and online tools AND tricks on how to better reach your audiences.
Still looking for more design tools? Check out my post on 34 Content Hacks Part 1 to get cool planning, writing & design tricks!


